M-01 · Operations
Dashboard
The view the whole firm opens the day on.
What it does
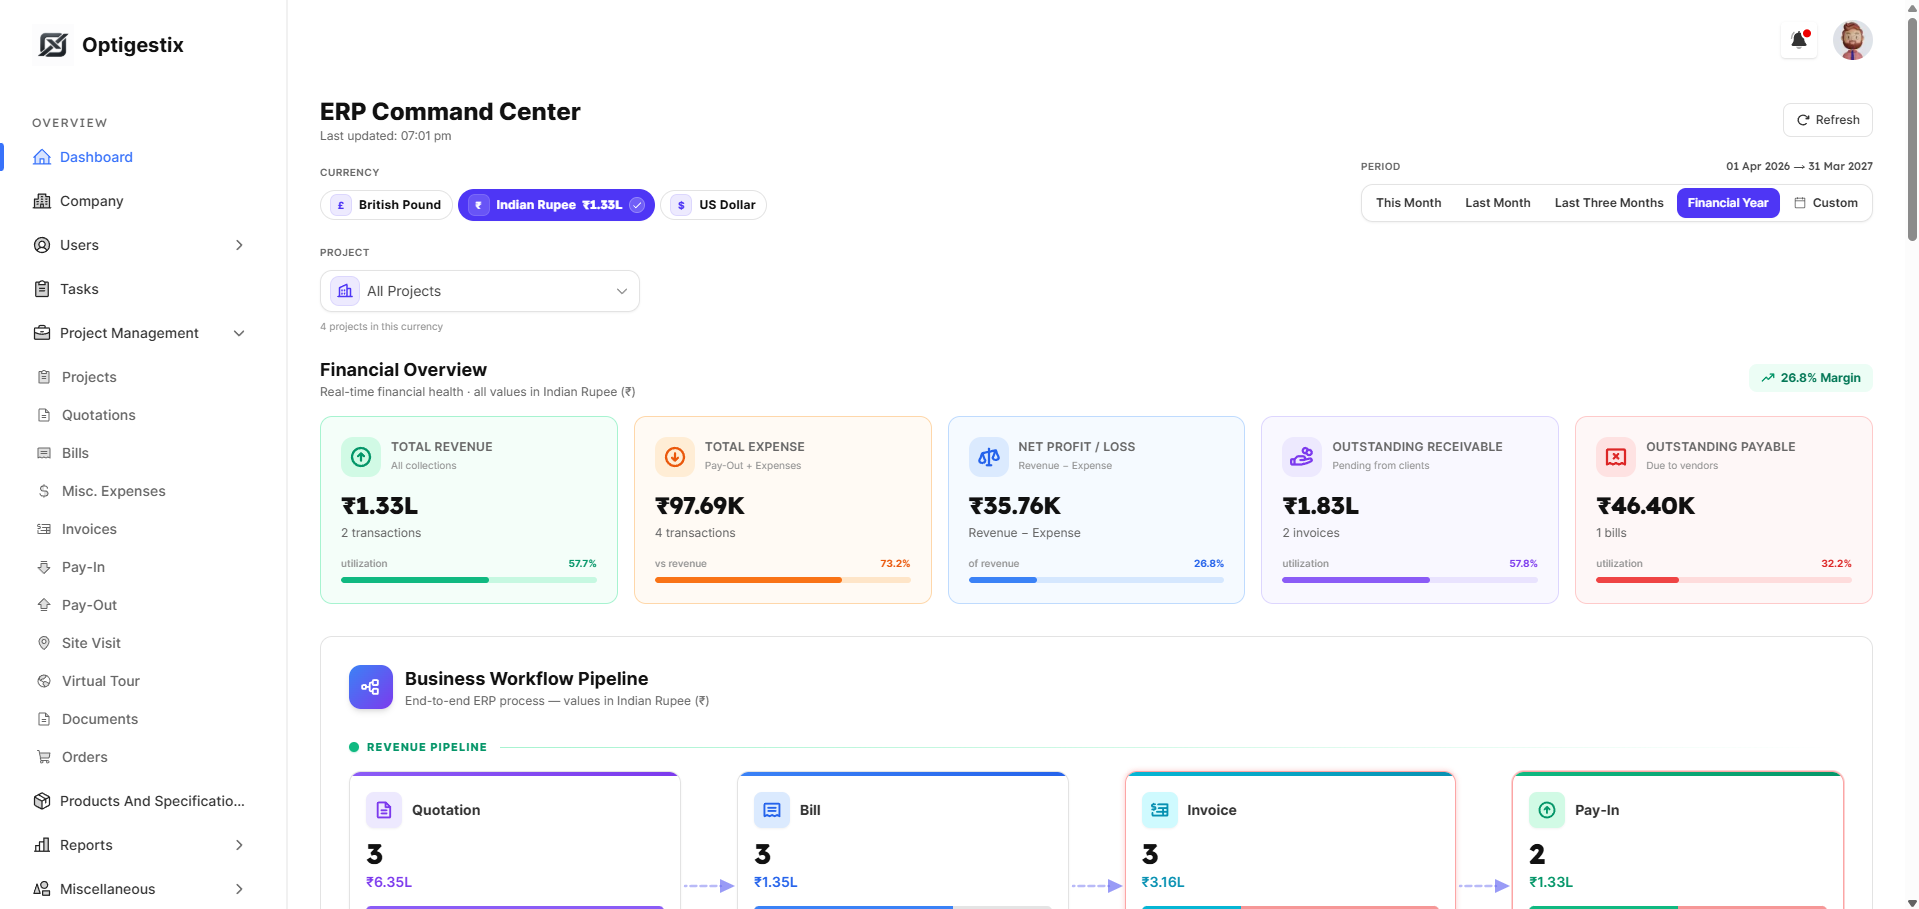
One screen carrying live project status, the financial position and the state of every workflow. Figures read in Indian Rupee, Pound Sterling or US Dollar, over this month, last month, the last three months, the financial year or a custom range.
- Financial overview: total revenue, total expense, net profit or loss, outstanding receivable and outstanding payable, each with its utilisation against revenue
- Business workflow pipeline from quotation through bill, invoice and pay-in
- Multi-currency and multi-period selection without leaving the page
- Reads from live records rather than a nightly export
Works with
Modules are integrated by default: these share the same records.
Dashboard is one of 16 modules, all sharing one login, one customer and one chart of accounts.